“Data is the new oil. It’s valuable, but if unrefined it cannot be used.” – Clive Humby, Data Scientist and Mathematician
This statement shows oil as a highly prized and valuable source, which is similar to data these days. It is also similar in a manner that it cannot be used without refining them and so is the case with data.
Data analysts analyze the vast amount of data to extract valuable advanced business data insights and change them into actionable insights that can drive value. Manufacturing data analytics is one example where refined data helps optimize production processes and boost efficiency
Now, the question is, what should we do with this huge amount of data available?
This blog post will explore some of the popular advanced data business analytics techniques that can help businesses utilize them to drive desired results.
But before we go into detail, let’s understand what advanced data analytics is.
What is Advanced Data Analytics?
Advanced data analytics is a strategy for automating business processes with a wide range of data science techniques. These include techniques like machine learning, predictive modeling, deep learning, and other statistical methods.
It is among the leading-edge data analysis methods that allow businesses to improve quality and make well-informed decisions using data assets.
Data analysts or scientists use advanced business analytics techniques to understand the pattern and future predictions. Beyond Business Intelligence practices, they use data science applications.
Some of the primary advantages of data analytics services are as follows:
- Enhanced prediction and forecasting models to be more accurate.
- A better understanding of market trends, consumer preferences, and behavior.
- Avoided expensive errors.
- Access to new business prospects.
- Addressed key issues with effective solutions.
- Sped up decision-making.
Discover how ValueCoders' expertise in cutting-edge techniques can transform your business insights.
Most Important Data Business Analytics Techniques
Using diverse data business analytics techniques can help you gain competitive benefits. Explore these data analytics techniques to choose the most suitable based on your business requirements.
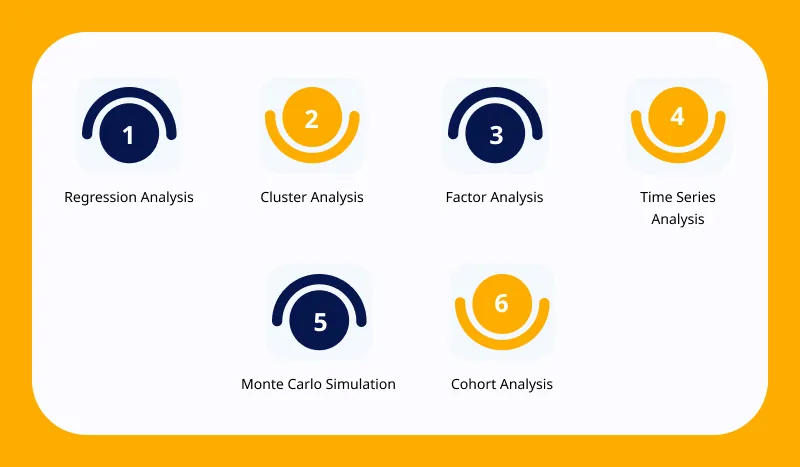
1. Regression Analysis
Regression analysis is a series of statistical methods that assist in evaluating the connection between dependent and independent variables.
Data scientists use regression analysis to assess the alliance of the variables and to simulate the future relationship between them.
Additionally, it can also be used to check the independent variables’ impact on dependent variables.
Businesses can also identify the connection between various volumes of product sales, and their pricing.
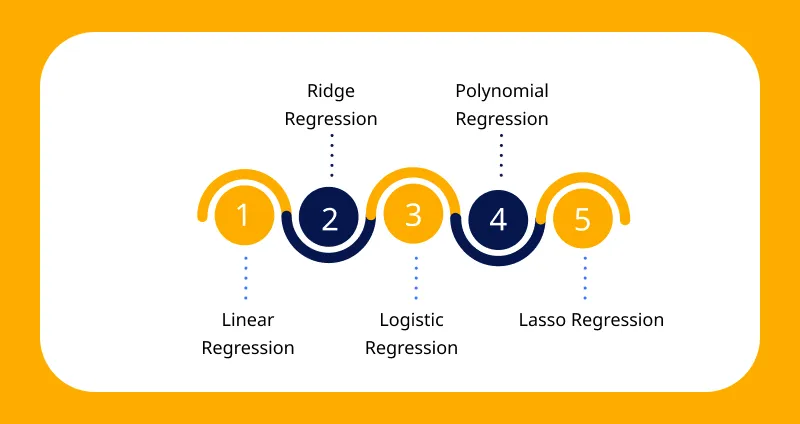
There are various types of Regression Analysis, like:
- Linear Regression: This analysis is a statistical method that finds the relationship between two variables by aligning a straight line to the data points.
- Ridge Regression: This technique is used to avoid overfitting in linear regression models by adding a penalty term to the coefficients.
- Logistic Regression: It is also an innovative statistical analysis in business. This method is used as predictive analytics for businesses to estimate the probability of a binary outcome depending on one or more predictor variables.
- Polynomial Regression: It is a type of regression analysis where the connection between the dependent and independent variable is modeled as an nth-degree polynomial.
- Lasso Regression: This is a method that performs both variable selection and regularization to interpret the statistical model and enhance the prediction accuracy.
Some of the major applications of Regression Analysis are:
- Sales and Promotions Forecasting
- Financial Data Analytics Forecasting (such as House Price Estimates or Stock Prices)
- Testing Automobiles
- Time Series Forecasting
- Weather Analysis and Prediction
2. Cluster Analysis
Cluster analysis is another data business analytics technique used to identify general patterns and explain data.
It is utilized when the data lacks clear labels and has complex labeling. The steps include identifying similar observations and assembling them to build clusters, and at the end assigning names and categories to these groups.
Cluster analysis helps to identify similarities and differences within datasets and showcase these to facilitate visual comparisons easily. In this approach, box plot visualizations are used frequently to highlight data clusters.
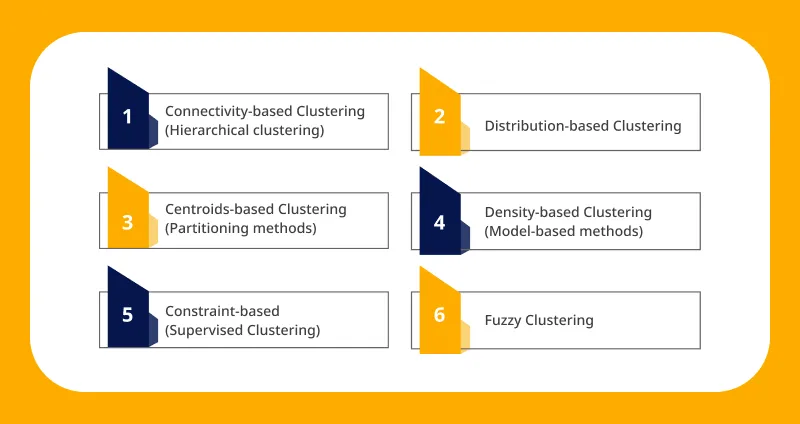
There are various types of Cluster Analysis, like:
- Connectivity-based Clustering (Hierarchical clustering): It groups data points based on their proximity to each other, forming hierarchical clusters that can be seen in a tree-like structure.
- Distribution-based Clustering: This identifies clusters by modeling the distribution of data points using statistical techniques like Gaussian mixture models.
- Centroids-based Clustering (Partitioning methods): It assigns data points to clusters by calculating the distance between each point and the centroid of a cluster, with popular methods including K-means and K-medoids.
- Density-based Clustering (Model-based methods): This forms clusters based on regions of high data point density, effectively identifying clusters of varying shapes and sizes in the data.
- Constraint-based (Supervised Clustering): This clustering incorporates prior knowledge or constraints into the clustering process, guiding the formation of clusters based on specific criteria or rules.
- Fuzzy Clustering: This allows data points to belong to multiple clusters with diverse membership degrees, accommodating uncertainty and overlapping clusters.
Some of the major applications of Cluster Analysis are:
- Geographic Information Systems (GIS)
- Collaborative Filtering
- Biology and Genetics
- Image Segmentation
- Document Clustering
Partner with ValueCoders to implement state-of-the-art techniques for unparalleled growth and innovation.
3. Factor Analysis
Factor analysis is also a type of statistical technique. It is used to decrease the large numerical variables to a small number of factors by exporting common variance. This is referred as dimension or data reduction.
It works in a manner where they exhibit correlations among themselves when multiple separate or observable variables are connected with a shared concept.
Factor analysis is the most trusted approach when it comes to examining variable correlations for complex subjects like psychological dimensions and socioeconomic status.
These business analytics techniques can help in examining if there’s any connection between the group of factors or not. The initial variable relationship structure can be examined by additional variables or elements that are disclosed at the end of this process.
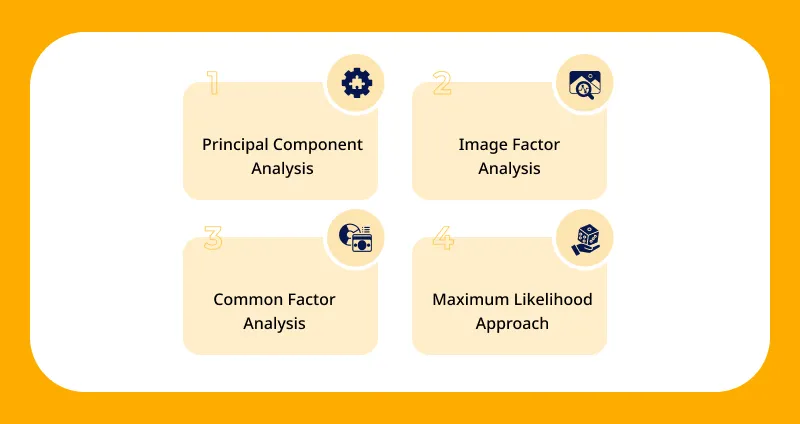
There are various types of Factor Analysis, like:
- Principal Component Analysis: This is a statistical business analytics technique used to simplify and identify patterns in data by changing it into a set of linearly uncorrelated variables called principal components.
- Image Factor Analysis: This method analyzes the common factors underlying a set of images, attempting to identify shared features or patterns among them.
- Common Factor Analysis: It is a statistical method used to determine the underlying structure of observed variables by identifying common factors that explain their relationship.
- Maximum Likelihood Approach: This method is used to predict the parameters of a factor model by increasing the likelihood function, letting the identification of factors that best explain the observed data.
Some of the major applications of Factor Analysis are:
- Marketing
- Machine Learning
- Nutritional Science
- Data Mining Techniques for Companies
4. Time Series Analysis
Time series analysis is a statistical data business analytics technique that recognizes patterns, trends, and cycles over time.
Time series data like weekly sales, monthly email sign-ups, and more are a set of data points that measure the same variable multiple times. In such cases, the data analysts can predict the future variations based on the variable interest by analyzing trends related to time.
This analysis requires a huge data to maintain reliability and consistency. In simple words, time series is a collection of data points arranged in sequence and the analysis is the act of interpreting that data.
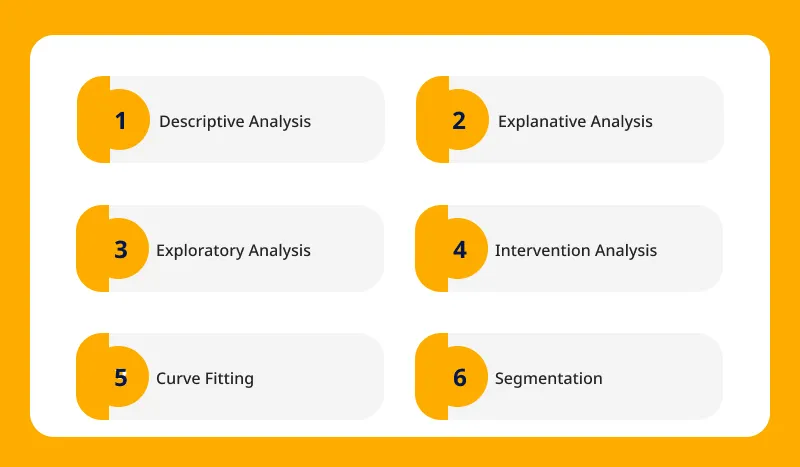
There are various types of Time Series Analysis, like:
- Descriptive Analysis: This examines historical data to summarize and describe key characteristics and trends over time.
- Explanative Analysis: This analysis seeks to identify and understand the factors that influence changes in a time series, exploring relationships between variables to provide explanations for observed patterns.
- Exploratory Analysis: This involves examining a time series dataset to discover hidden patterns, relationships, or anomalies, often using visualizations and statistical techniques to generate hypotheses for further investigation.
- Intervention Analysis: This evaluates the impact of external events or interventions on a time series, such as policy changes or marketing campaigns, to assess their effectiveness and understand their effects on the data.
- Curve Fitting: It involves fitting mathematical models or equations to a time series dataset to describe its underlying trend or pattern, enabling better understanding and prediction of future values.
- Segmentation: This analysis divides a time series dataset into distinct segments or clusters based on similarities in patterns or characteristics, allowing for targeted analysis and decision-making for different subsets of the data.
Some of the major applications of Time Series Analysis are:
- Economic Forecasting
- Energy Consumption Forecasting
- Stock Market Analysis
- Quality Control
- Traffic and Transportation
5. Monte Carlo Simulation
The Monte Carlo is a business analytics technique used to predict the possible outcome of an unpredictable event. These estimates are made based on range of values rather than fixed set of values.
Computers are used for Monte Carlo simulation to examine data and predict outcomes about the course of action.
This data analytics technique is also used to identify the impact of uncertainty and risk.
The Monte Carlo technique is also known as a multiple probability simulation or Monte Carlo method.
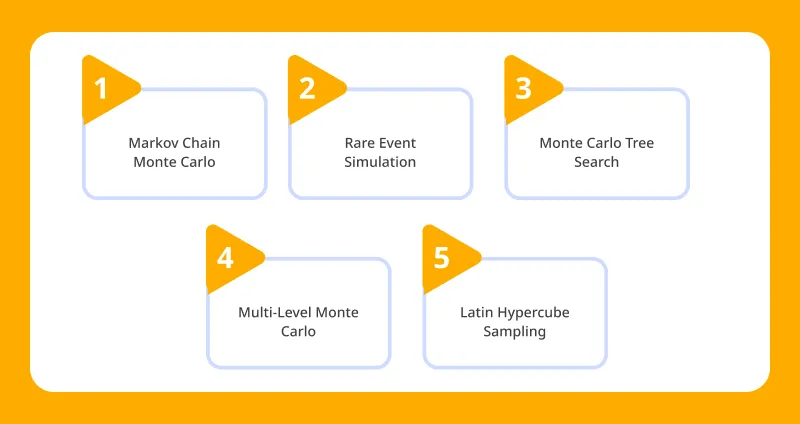
There are various types of Monte Carlo Simulation, like:
- Markov Chain Monte Carlo (MCMC): MCMC is a computational method used to estimate the distribution of complex systems by systematically sampling from a Markov chain until it converges to the desired distribution.
- Rare Event Simulation: It is a technique used to estimate the probability of rare or extreme events occurring in a time series by simulating the system over a large number of iterations.
- Monte Carlo Tree Search (MCTS): This algorithm is used to find optimal decisions in decision trees or game trees by simulating future states and selecting the most promising actions based on the outcomes of these simulations.
- Multi-Level Monte Carlo (MLMC): MLMC is a method that combines multiple levels of approximation to efficiently estimate expectations or probabilities in time series, reducing computational cost while maintaining accuracy.
- Latin Hypercube Sampling (LHS): LHS is a technique used to generate samples from a multidimensional distribution in a way that ensures uniform coverage of the sample space, often employed in time series analysis to reduce sampling bias and improve efficiency.
Some of the major applications of Monte Carlo Simulation are:
- Structural Analysis
- Reliability Analysis
- Optimization Problems
- Queueing Systems
- Climate Modeling
- Natural Disaster Risk Assessment
ValueCoders' expertise in machine learning algorithms can optimize operations and drive profitability.
6. Cohort Analysis
Cohort analysis is a popular data business analytics technique that breaks or bifurcates common characteristics data into groups before the analysis.
This technique is used to better understand user behavior in particular cohorts, optimize customer retention, and make it easier for organizations to analyze, isolate, and, uncover trends in the user lifetime.
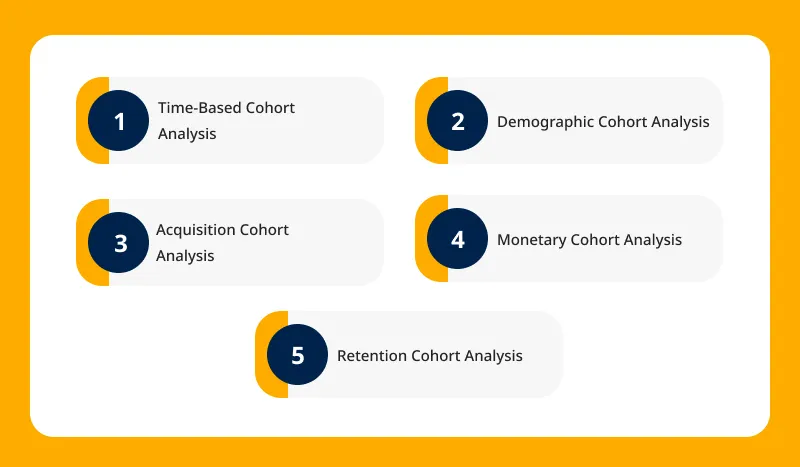
There are various types of Cohort Analysis, like:
- Time-Based Cohort Analysis: This analysis groups customers based on their first interaction or purchase date to track their behavior and performance over time, providing insights into changes in customer engagement and retention rates.
- Demographic Cohort Analysis: It categorizes customers into groups based on demographic attributes like age, gender, or location, allowing businesses to understand how different demographic segments behave and interact with their products or services.
- Acquisition Cohort Analysis: This analysis groups customers based on the time they were acquired or joined the business, enabling companies to evaluate the effectiveness of their marketing and acquisition strategies over time.
- Monetary Cohort Analysis: It segments customers based on their spending behavior or purchase amounts, helping businesses identify high-value customers, analyze spending trends, and tailor marketing efforts accordingly.
- Retention Cohort Analysis: This analysis categorizes customers based on their retention or repeat purchase behavior, allowing companies to identify factors influencing customer churn, assess customer loyalty, and implement strategies to improve retention rates over time.
Some of the major applications of Cohort Analysis are:
- Healthcare Data Analytics and Patient Outcomes
- Product and Feature Performance
- Subscription and Membership Services
- Social Sciences
- Real Estate
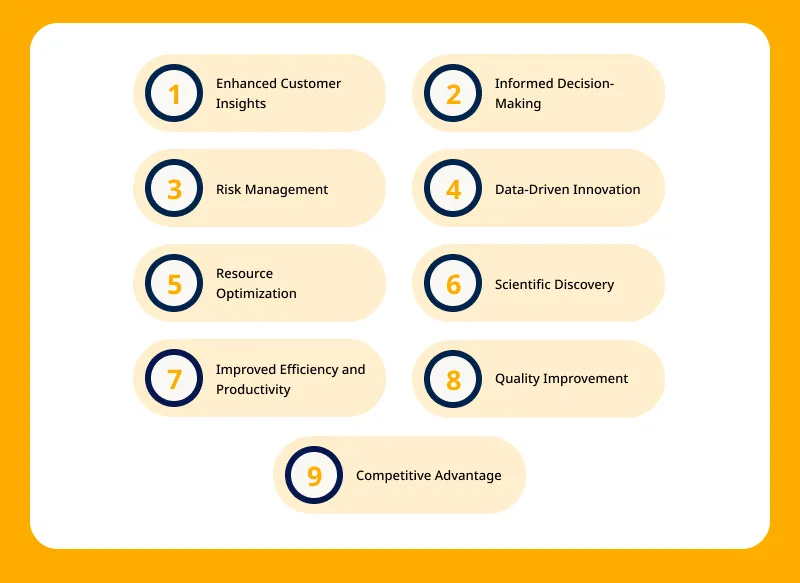
Advantages of Advanced Analytics Techniques
Data business analytics techniques offer several key advantages that can benefit organizations and individuals across various domains. Some of the key advantages include:
Also read: How Big Data Analytics In Retail Industry Is Transforming The World
Technologies Used for Data Analysis
As you may have understood by now every step of the data analysis process needs a data analyst with efficient tools to help them extract useful data insights.
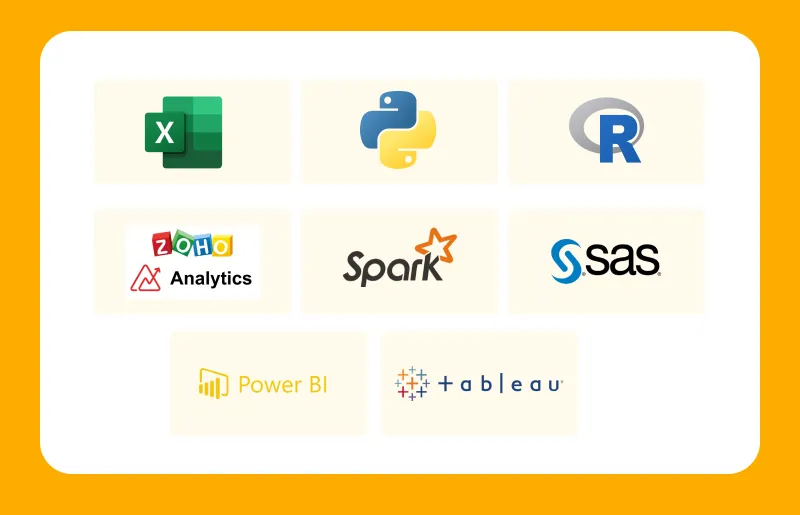
Let’s have a look at some of the best data analytics tools and technologies that can considered:
- Microsoft Excel
- Python
- R
- Zoho Analytics
- Apache Spark
- SAS
- Microsoft Power BI
- Tableau
ValueCoders' expertise in machine learning algorithms can optimize operations and drive profitability.
Final Thoughts!
Now is the time to utilize the data you may have collected from diverse sources.
Using advanced analytics, businesses can have access to valuable insights into their customers, operations, and marketers by using different types of data business analytics techniques.
Regardless of your business needs and goals, fine-tuning marketing strategies, optimizing internal processes and advanced analytics can empower your business to stand out.
However, you must not forget that advanced analytics alone is not enough; you need skilled experts who understand your data business analytics techniques requirement.
Not only that, you need commitment from the data analytics consulting services company that can help you grow.
ValueCoders has a team of big data consulting services experts that can help you perform the right analysis based on your business needs.
Contact our experts for the right guidance and book your free consultation…!!


