The client wanted to enhance their learning management system for their education network. The primary goal was to modify the LMS that could analyze solutions like classroom management, content management, attendance systems, grade books, parent communications, and more.
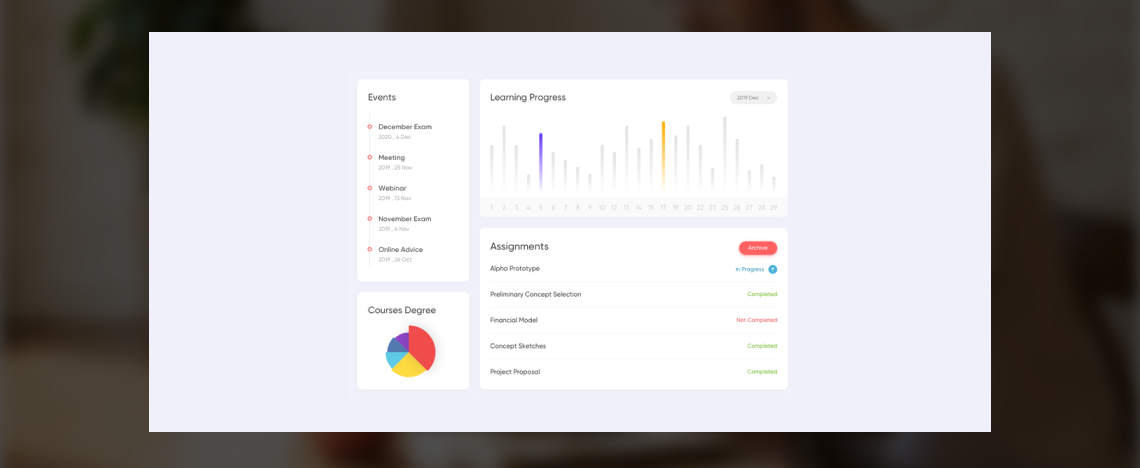
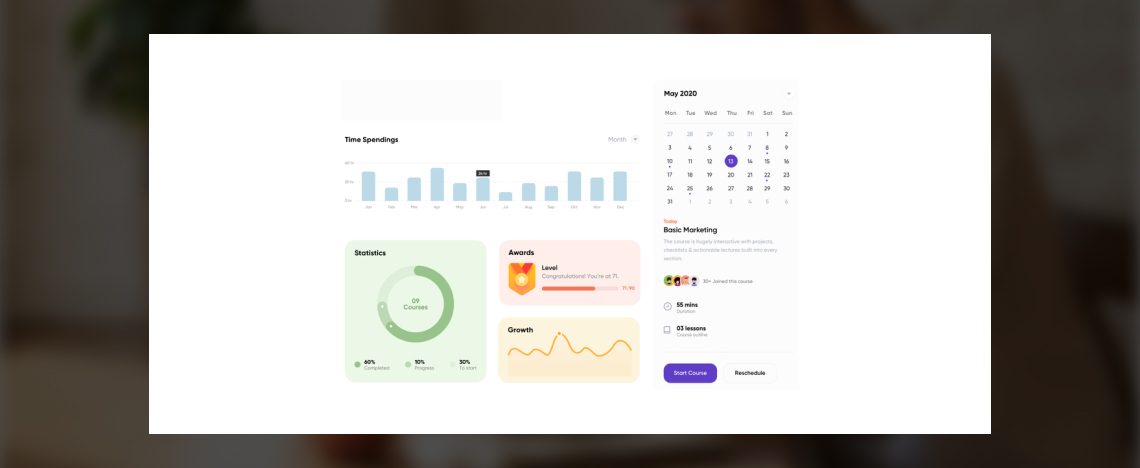
Schools and organizations can retrieve data from different sources like a student information system, test score records, etc., and use it to create dashboards and reports in Power BI.
They can use this data to analyze and visualize the student’s performance, grades, attendance, parent engagement, etc. The use of Power BI in analytic applications to analyze data trends, student pattern, teachers, and their study programs are secured using row-level security.
The visual representation of students’ information provides a chance for comparative analysis and assessment of students’ performance. That is, student’s grades can be analyzed in the context of their attendance, test scores, etc. With the help of this, both teachers and parents can detect patterns and loopholes in a student’s performance through informative visual analysis; they know what teachers and students need to work on to attain a better result. Integrating Power BI into standard LMS solutions has opened new revenue opportunities. This approaches state, provincial and national departments of education to use their analytics and management services.


